Flight Arrival Delay Investigation
The following project was completed using the nycflights13 dataset available for download in R. This project was completed for Ohio State's Data Analytics senior capstone class, along with two other teammates. Our task was to, in the span of less than two weeks, produce professional business insights from the data advising the port authorities on the significant delays facing their airports. Data cleaning, exploration, analysis, model building, and visualization was all completed using RStudio.
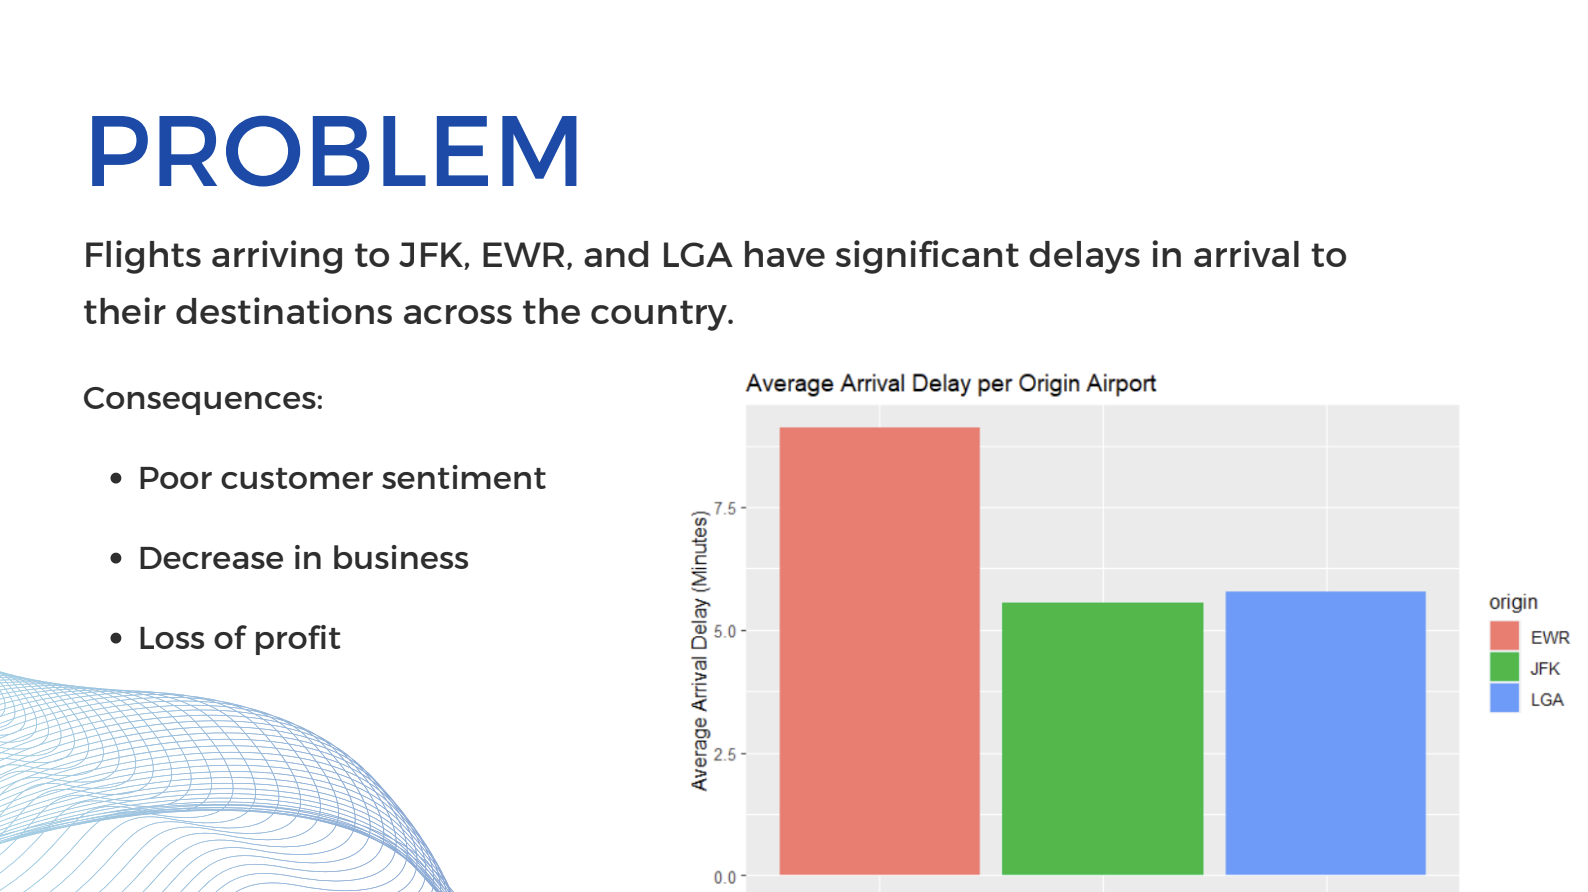
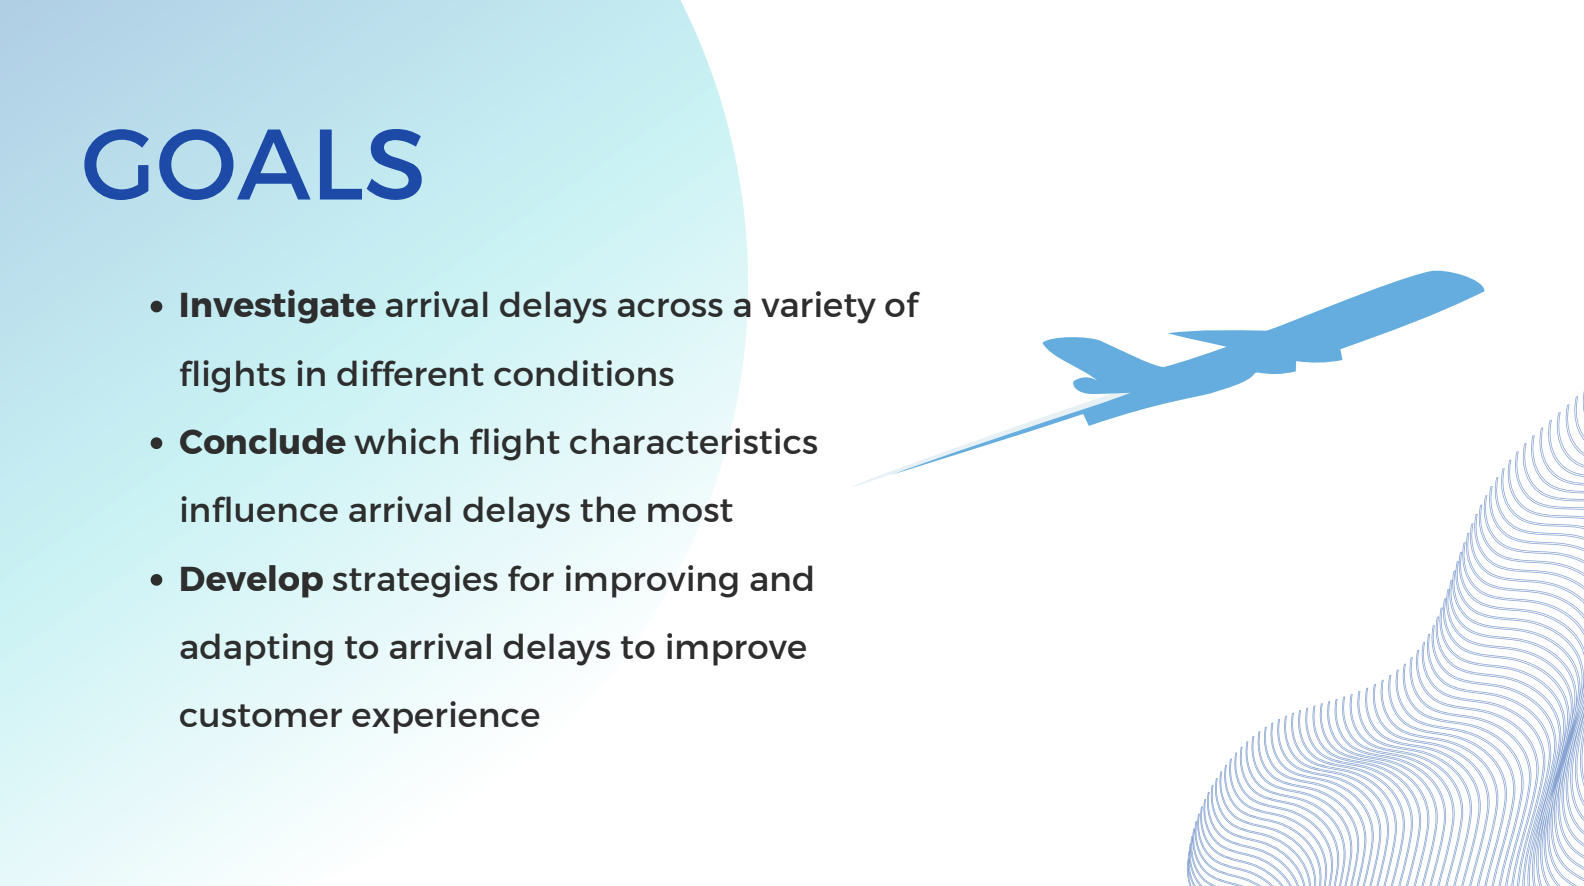
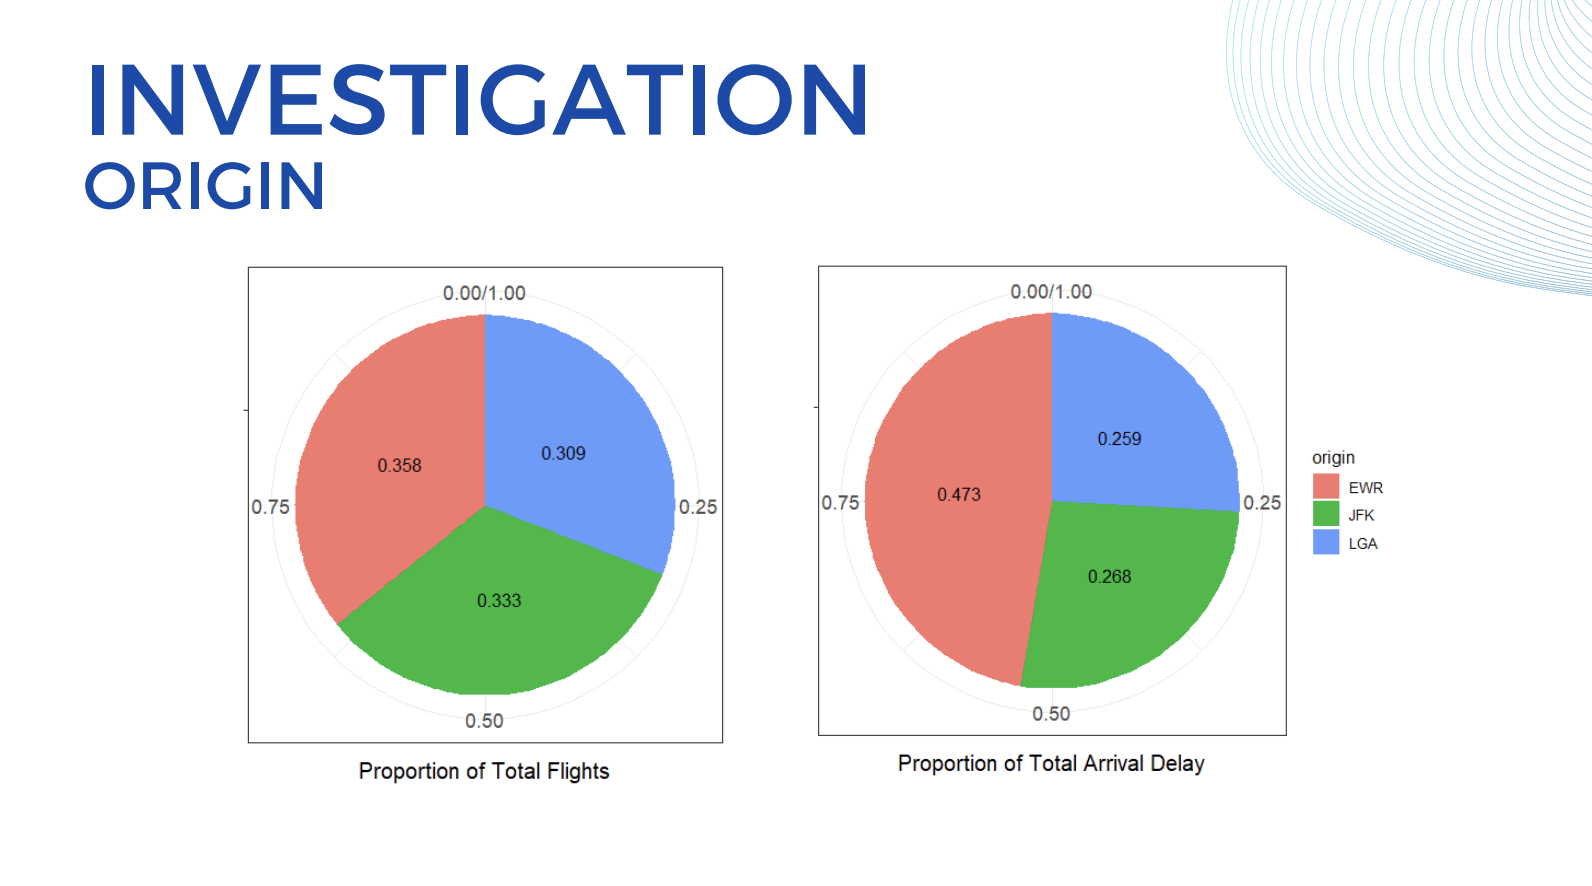
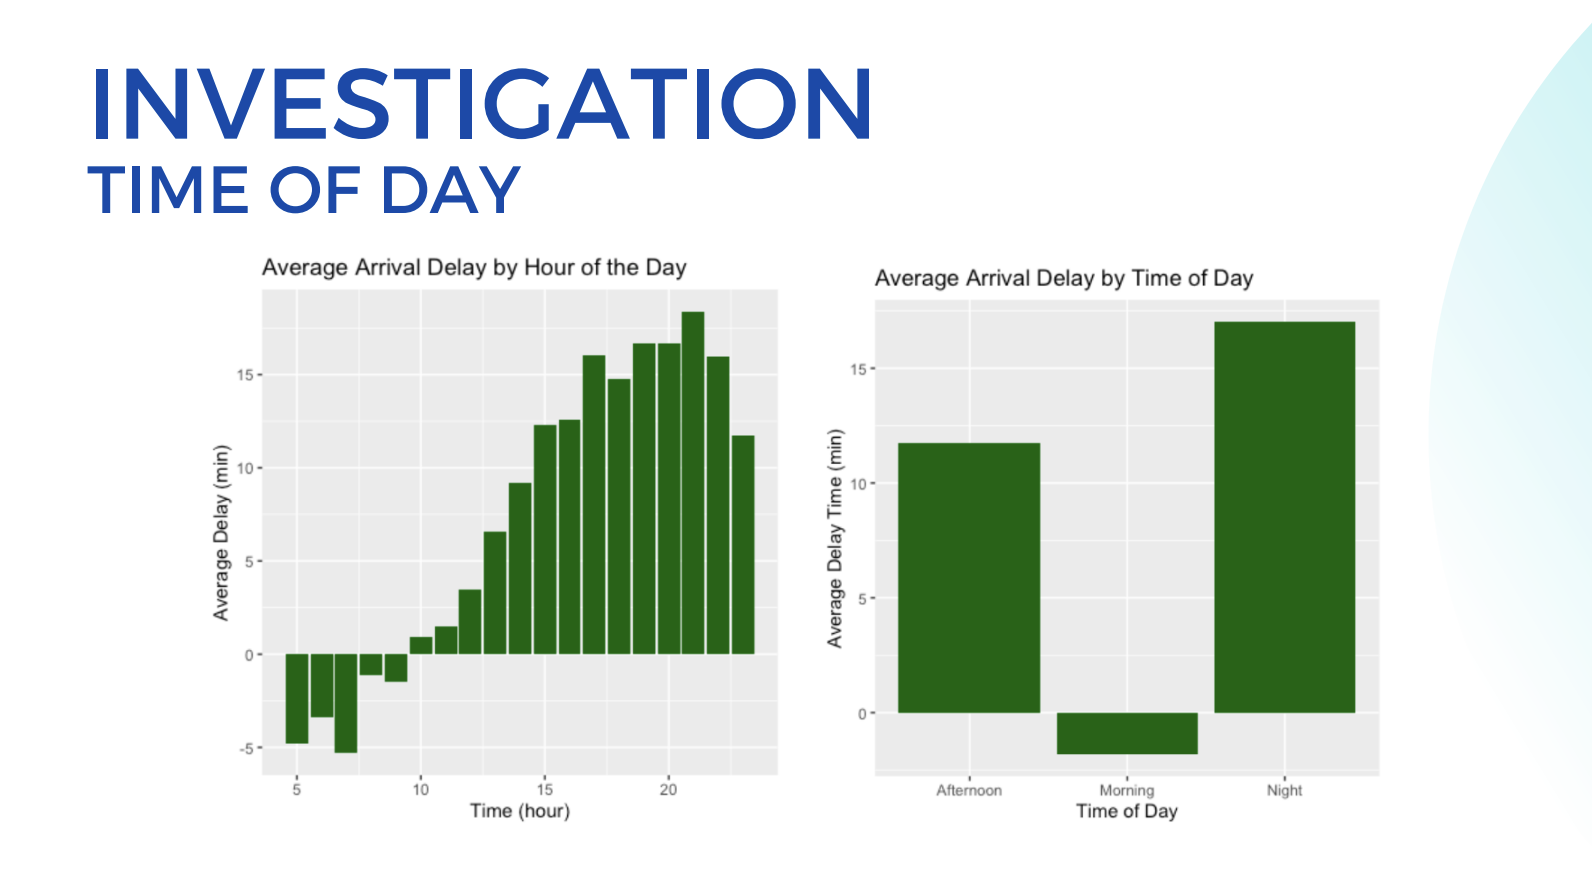
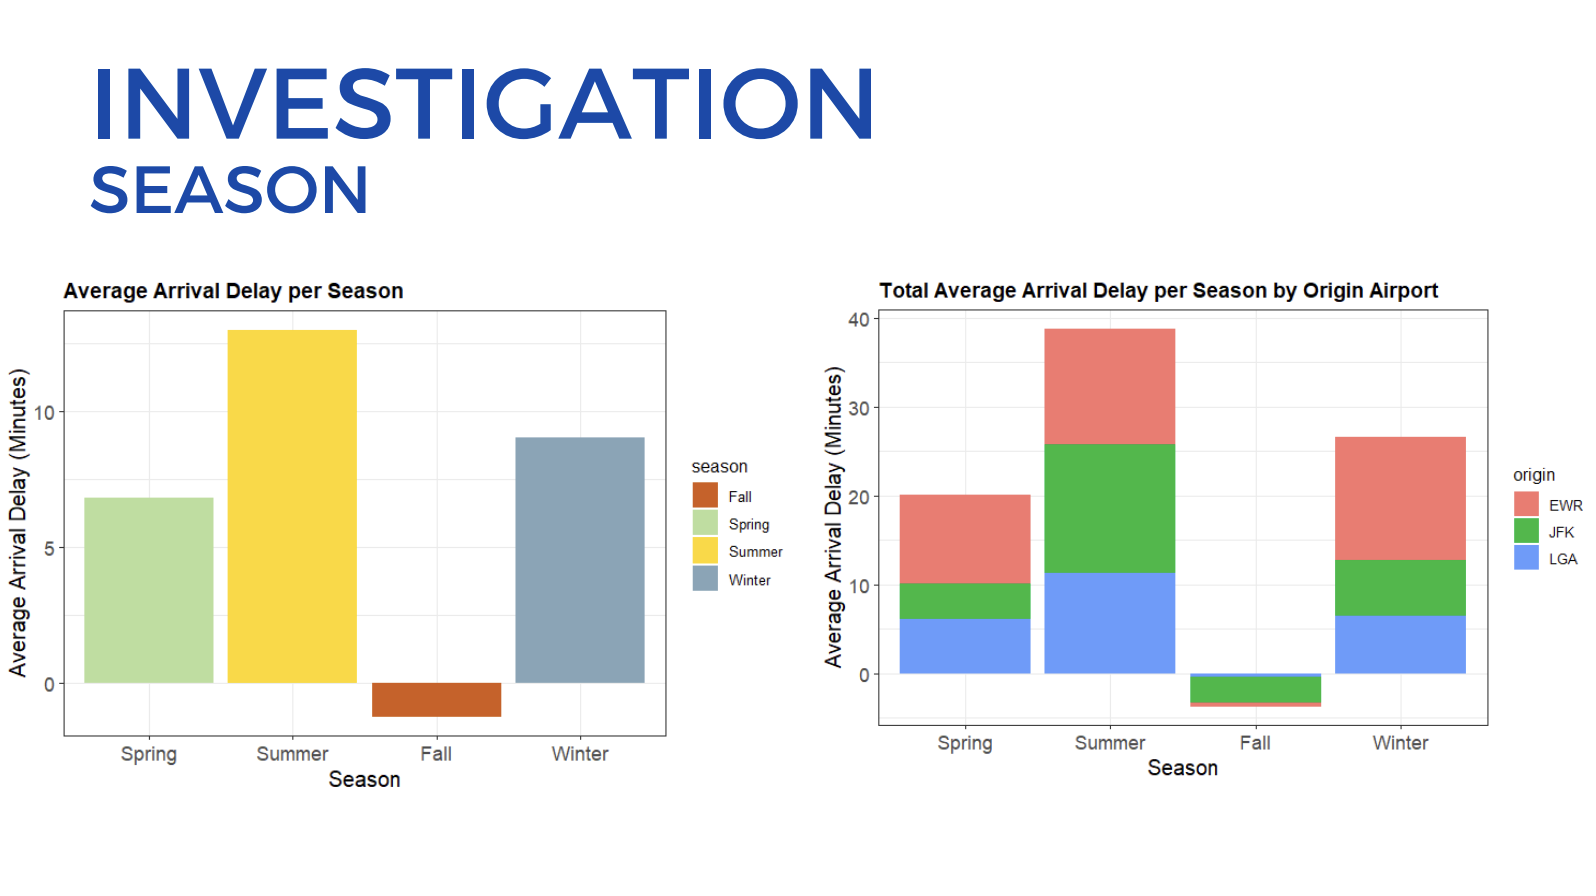
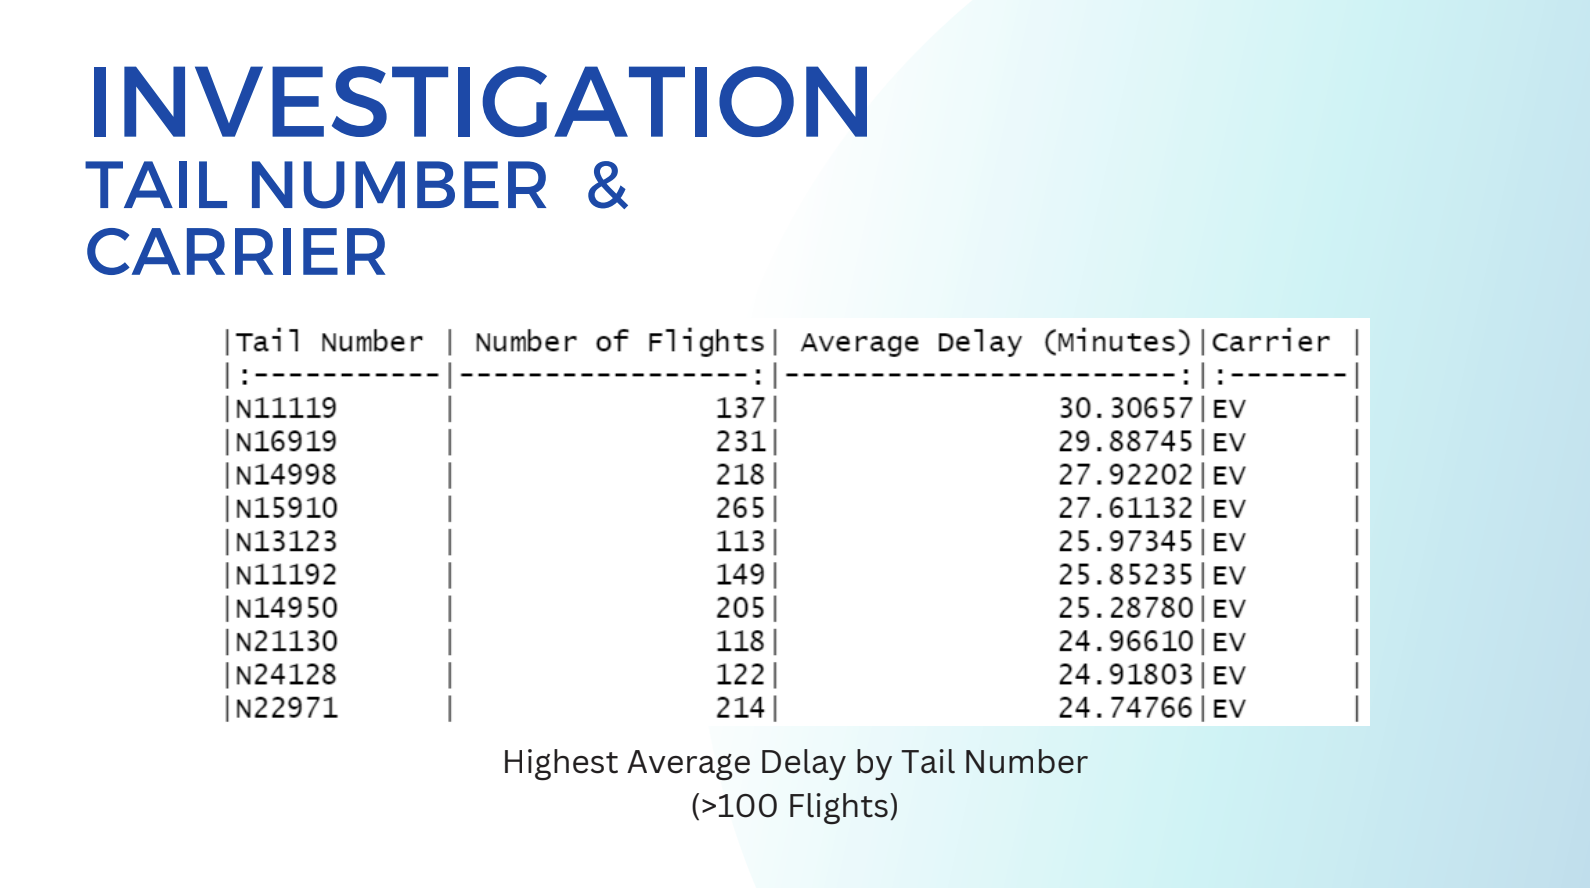
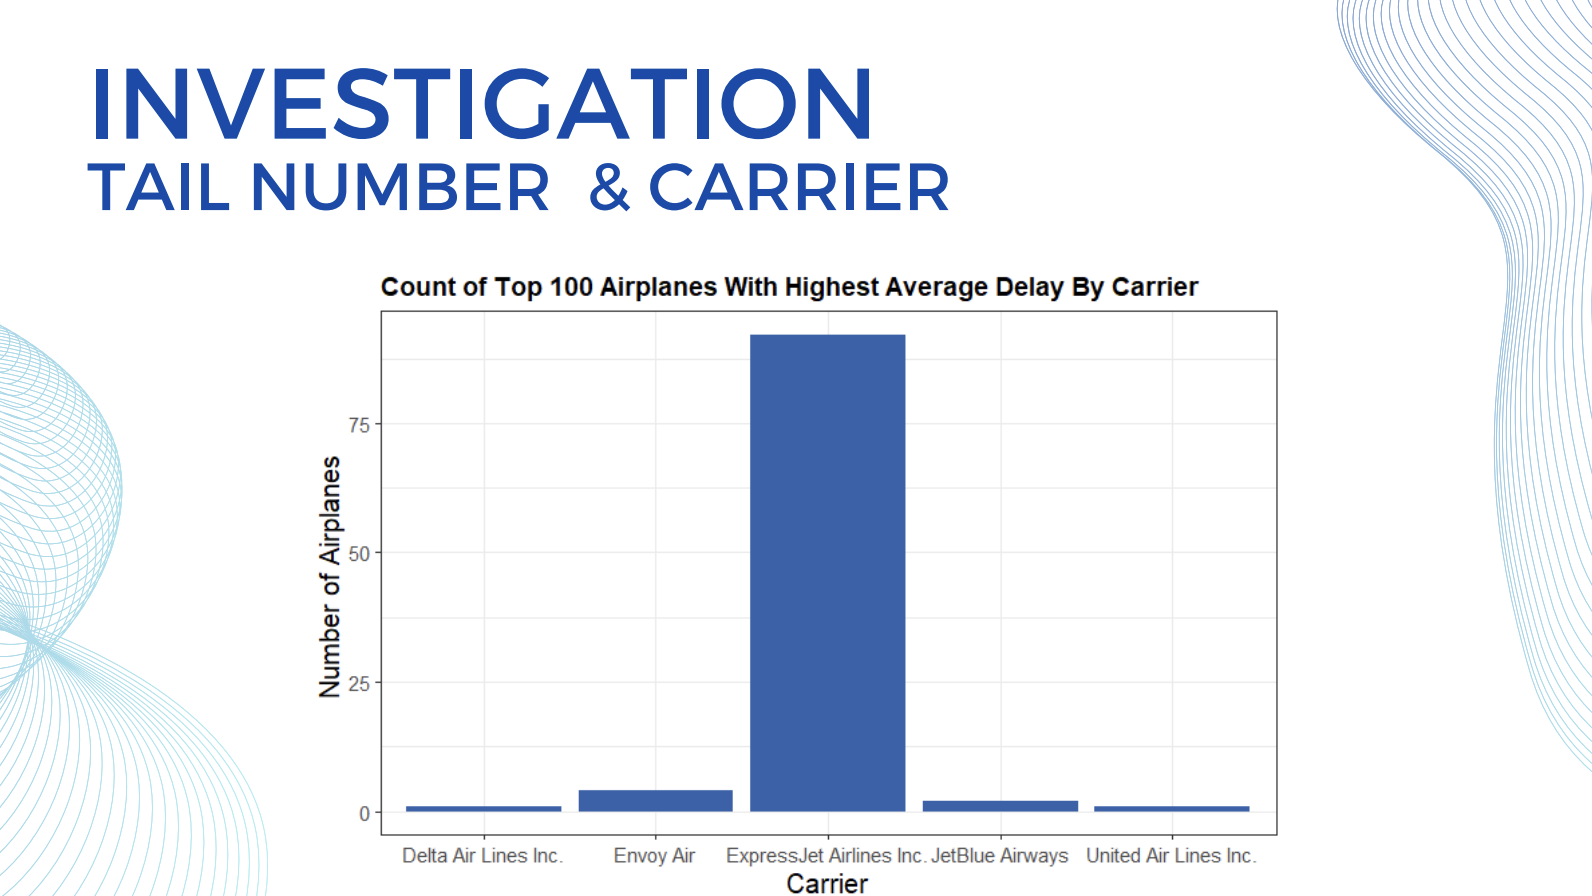
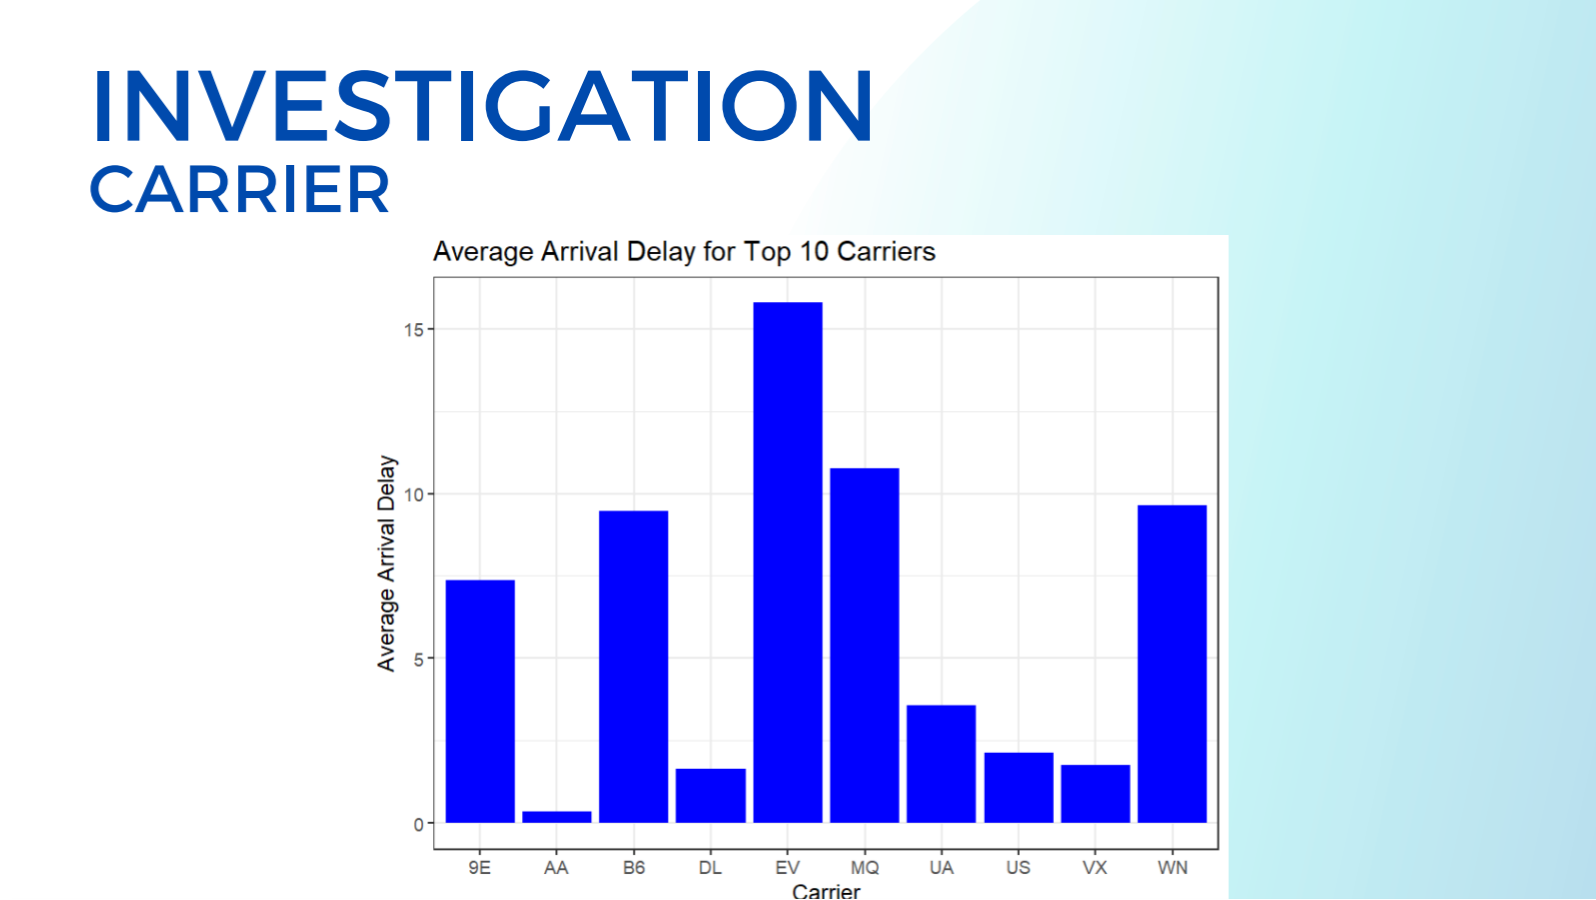
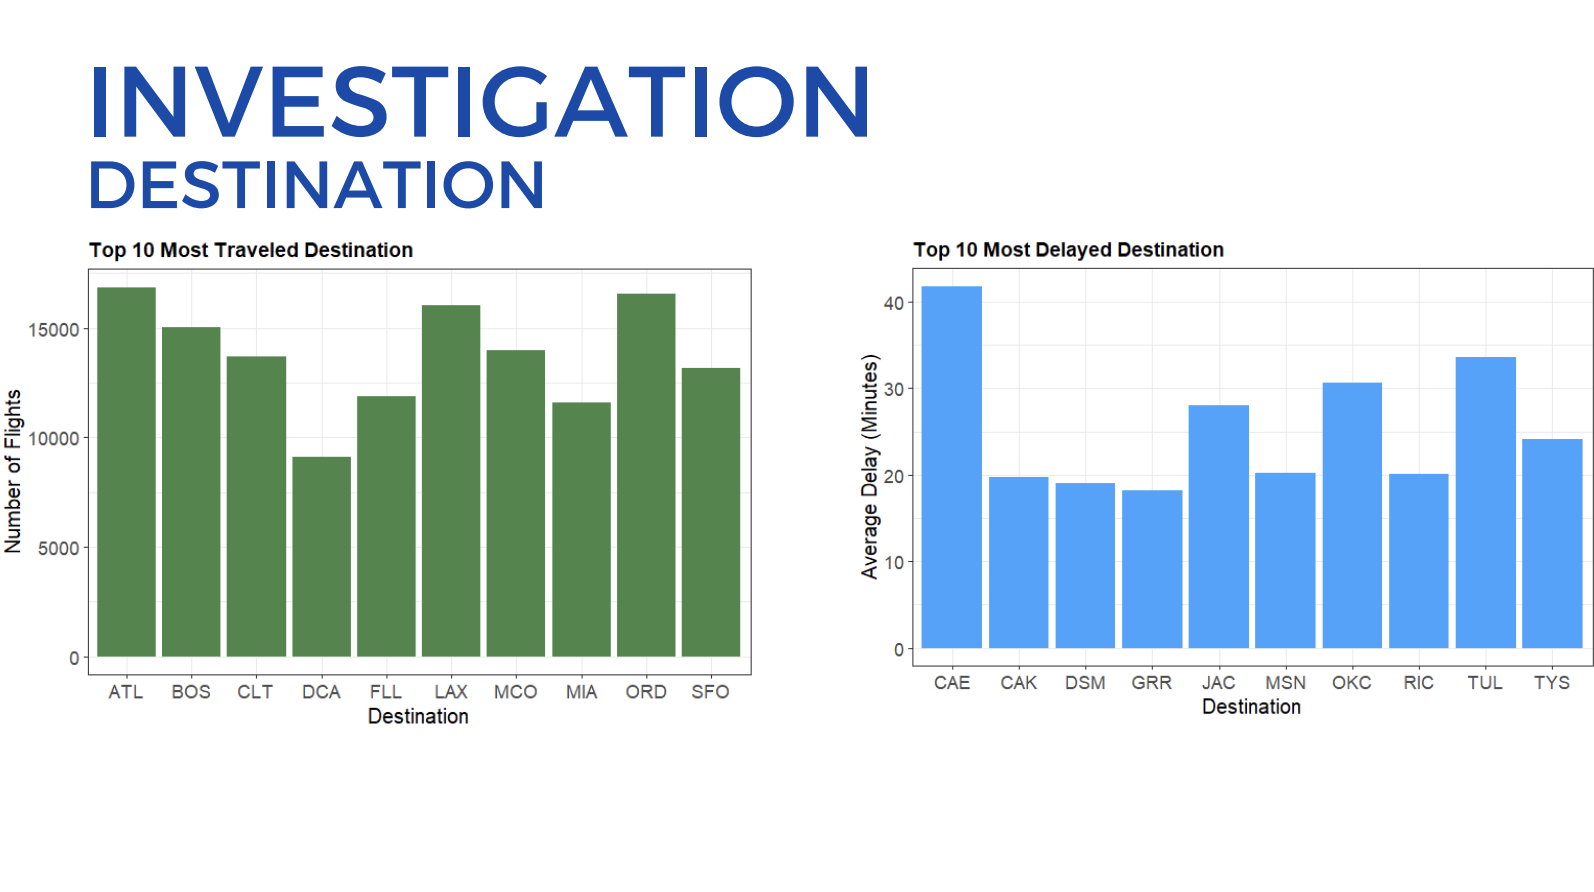
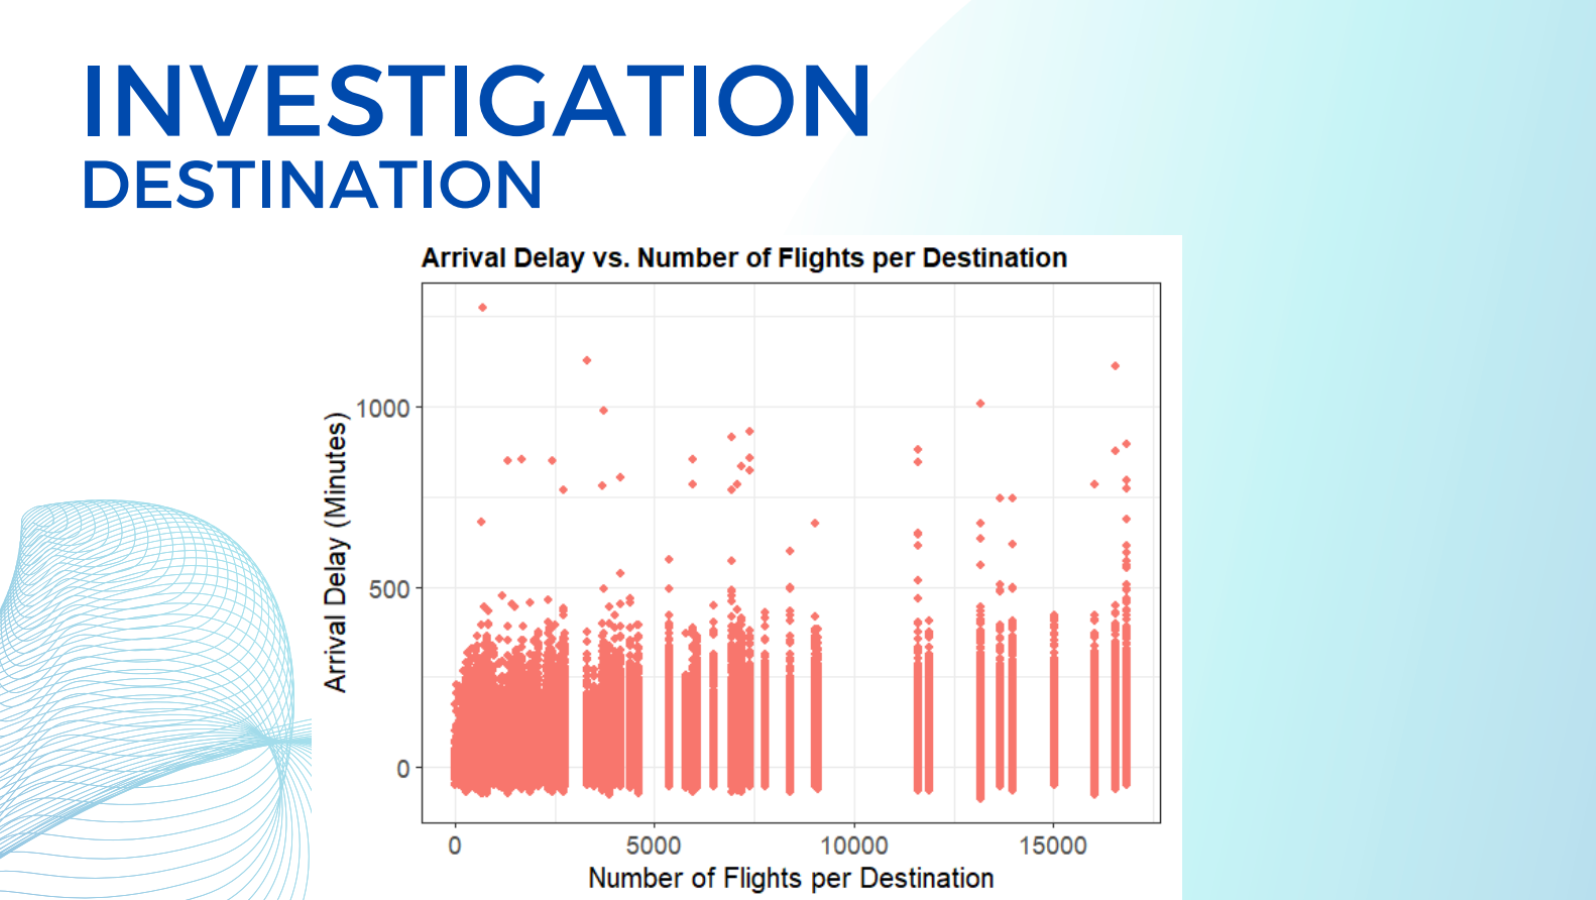
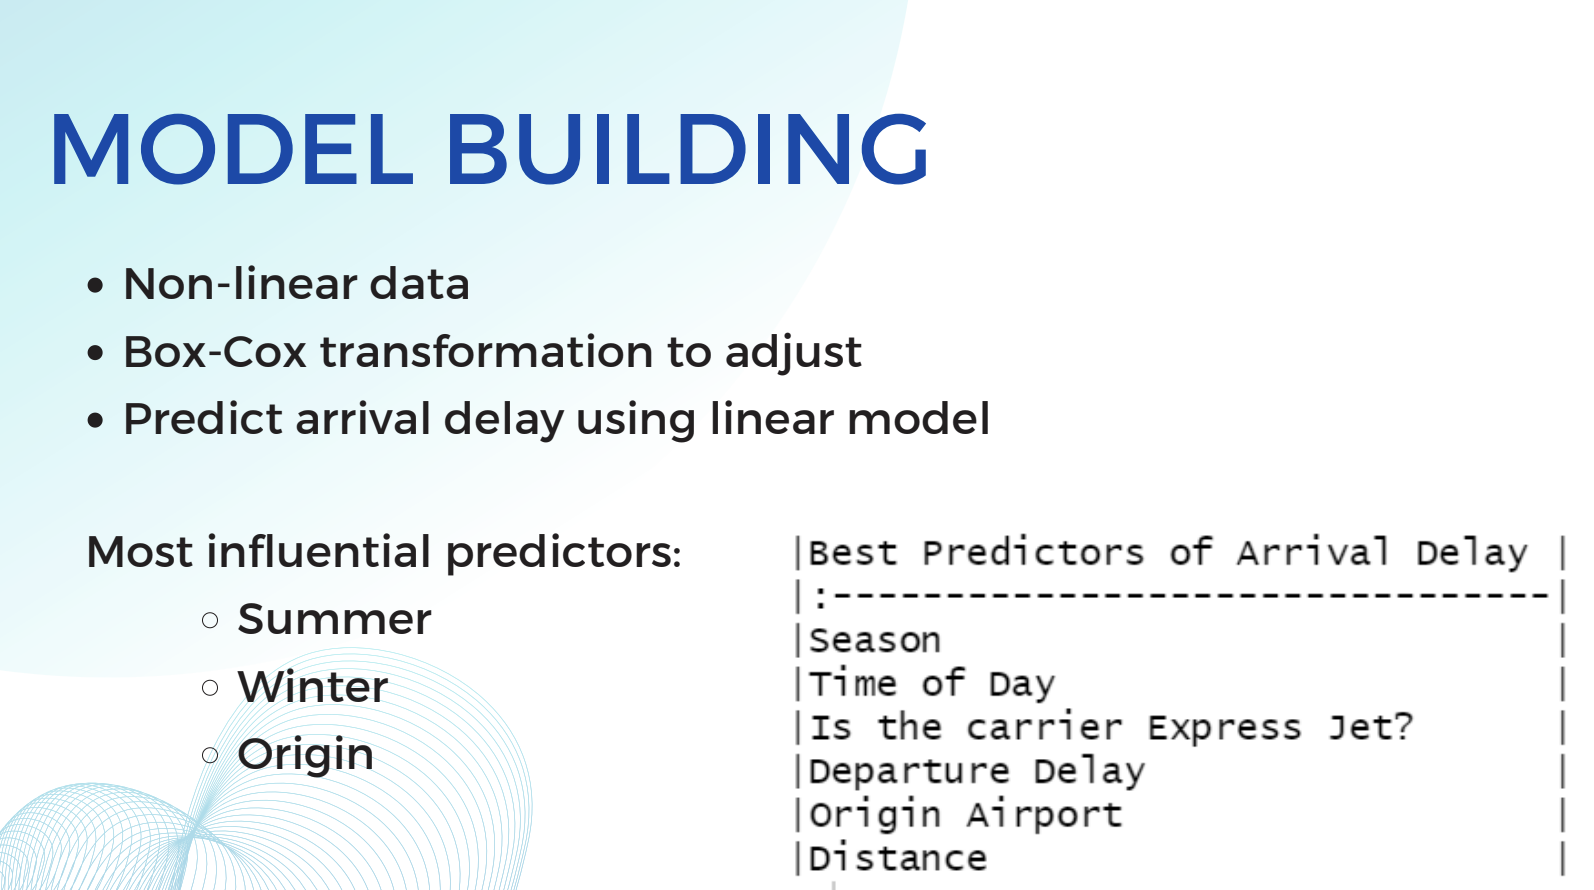

After assessing the structure of the data, addressing missing data, and cleaning the data, our team began our exploratory data analysis, with the end goal of better understanding the factors contributing to the delayed arrival of flights. This was done through a series of evaluative visualizations, purposeful data segmenting, and assessment of potential variable correlation. Once we had a stronger understanding of the data and influential factors at hand, we created a linear regression model after transforming the non-linear data to predict arrival delays. All relevant insights, visualizations, and key takeaways from our statistical work in R were included in our presentation, focusing on explaining and delivering conclusions for the business-facing stakeholders. Although we did not present to the actual Port Authority, we received professional-level feedback from our instructor and classmates. This project provided me with valuable experience delivering meaningful business strategy insights from raw data in an accelerated timeline.